Session structure, drawn automatically, on any bar type.
Volume Profile
Volume Profile anchors a profile to each trading session and keeps it there — current, prior, and a configurable run of history — with point of control, value area high and value area low marked on every one. It reads the chart's own Trading Hours template, so a session is whatever your chart already says it is.
Specification
Method
Bar-based. Each bar's volume is distributed evenly across the price levels its range spans — the standard approximation for a profile that does not consume a tick feed. For per-trade volume at price, see True Aggression Profile.
Chart types
Any. No secondary data series, no Tick Replay.
Calculation
On bar close, with an intrabar refresh throttle if you switch it.
Reads out to strategies
POC, VAH, VAL and total volume for current and prior session.
Built for structure
Where the auction spent its time.
Sessions resolve through NinjaTrader's own session iterator rather than a typed clock window, so globex, RTH and half-days land where they should without you adjusting anything. Profiles render behind the bars by default, at a width and opacity you set, and the value area is shaded rather than outlined so it reads at a glance without competing with price.
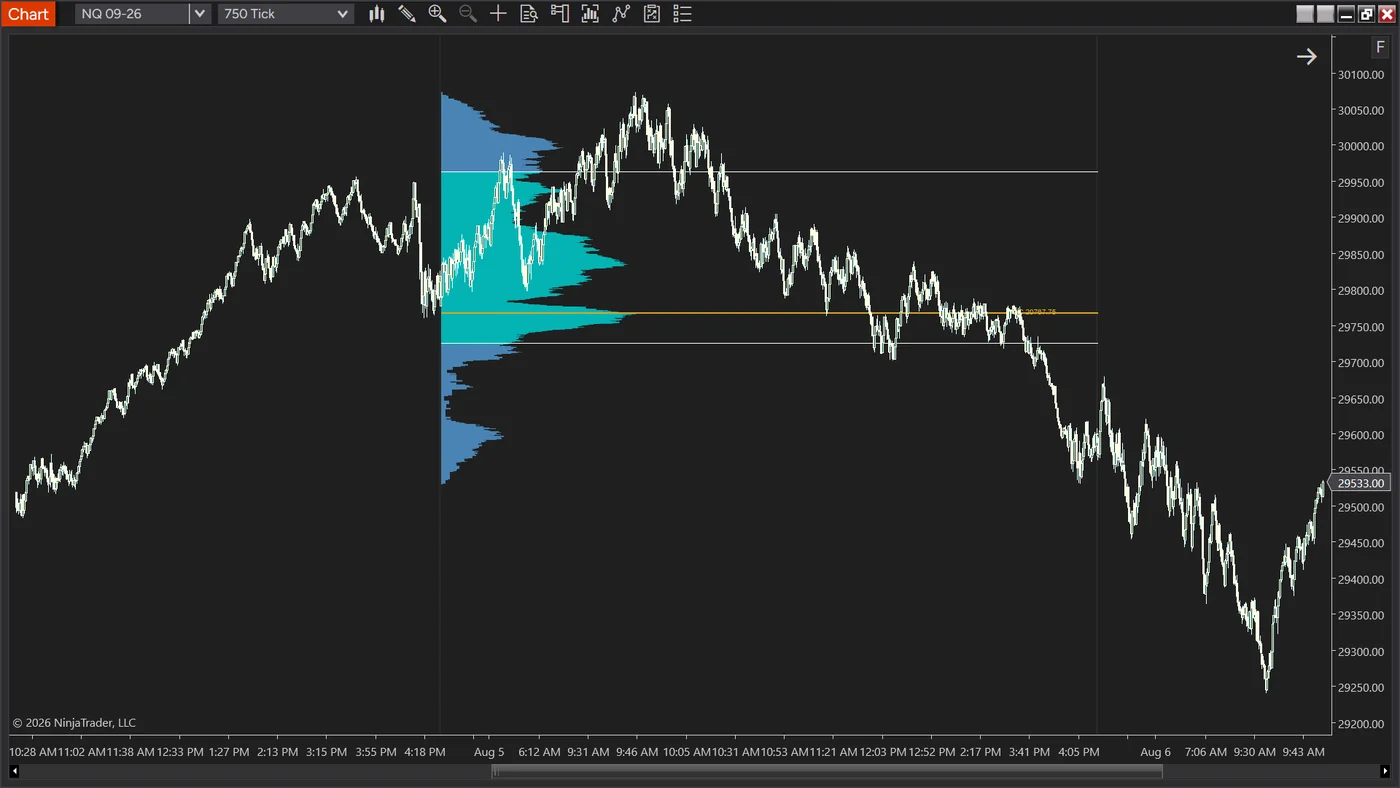
NQ 09-26 · 750 tickThe profile sits behind price at the session open, not off to the side of the chart. Value area shaded teal between the white VAH and VAL rails, the thinner volume outside it in blue, point of control drawn forward as the orange line at 29787.75. Price left the value area, spent the back half of the afternoon grinding along that one line, and only trended once it lost it.
01
Current, prior and historical session profiles, with POC, VAH and VAL on each.
02
Ticks per level, value area percent and POC tie-break are all yours to set.
03
Draws behind price bars, with heatmap or value-area colouring and a width you control.
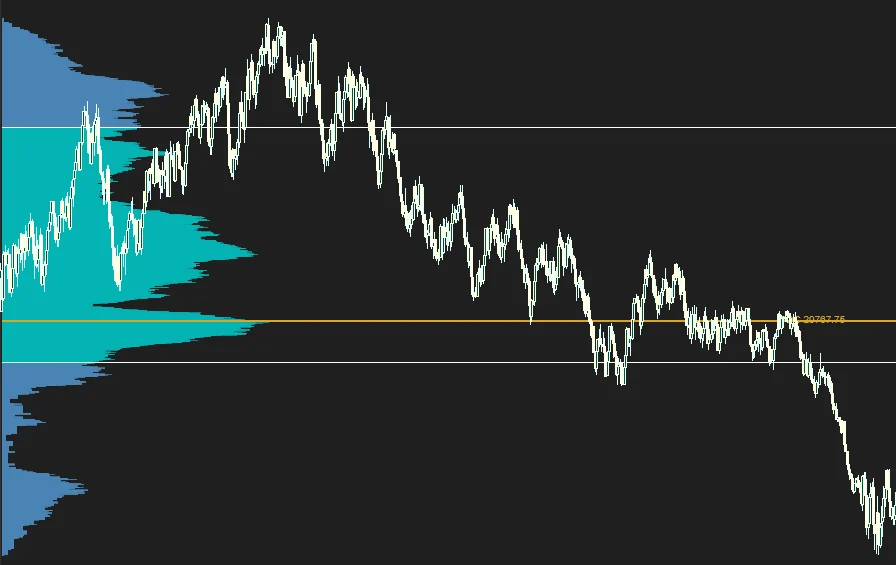
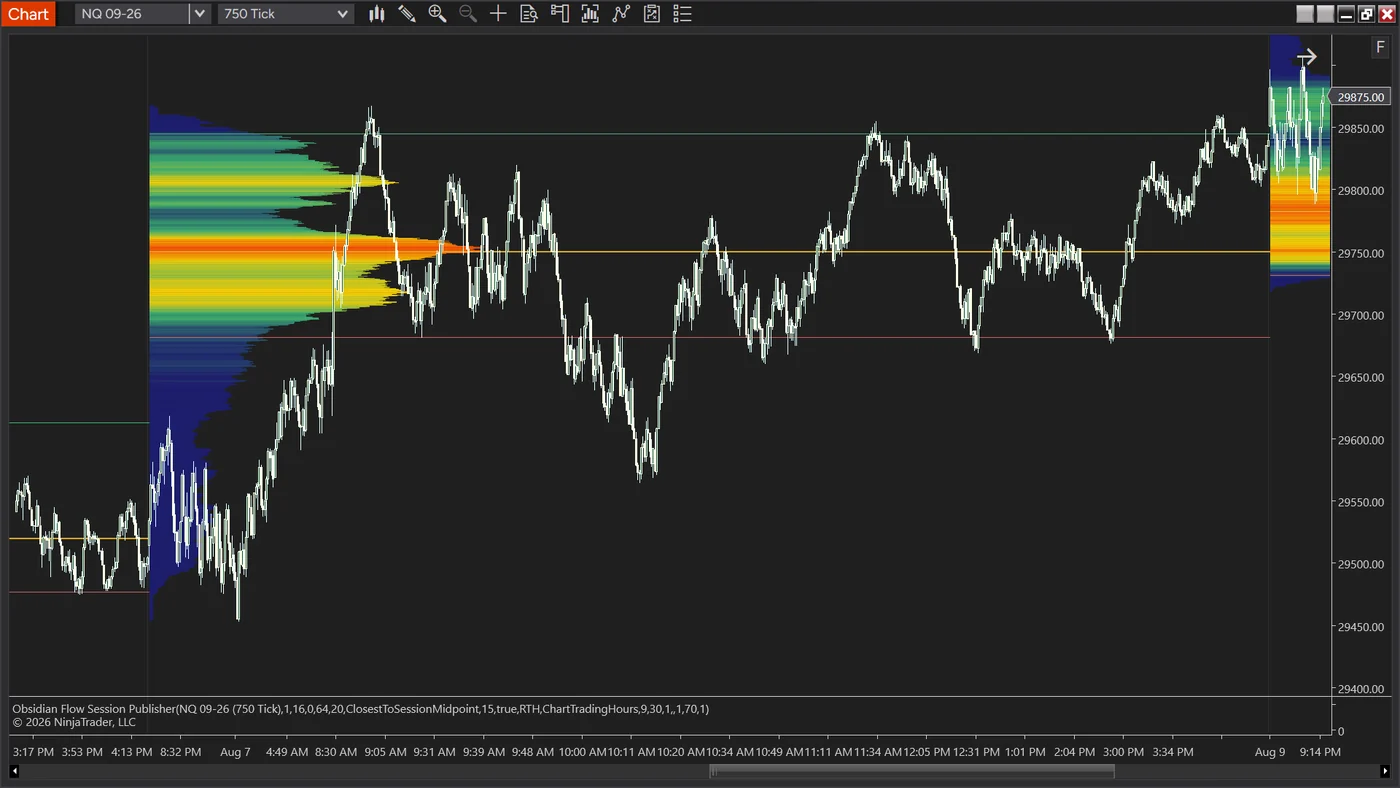
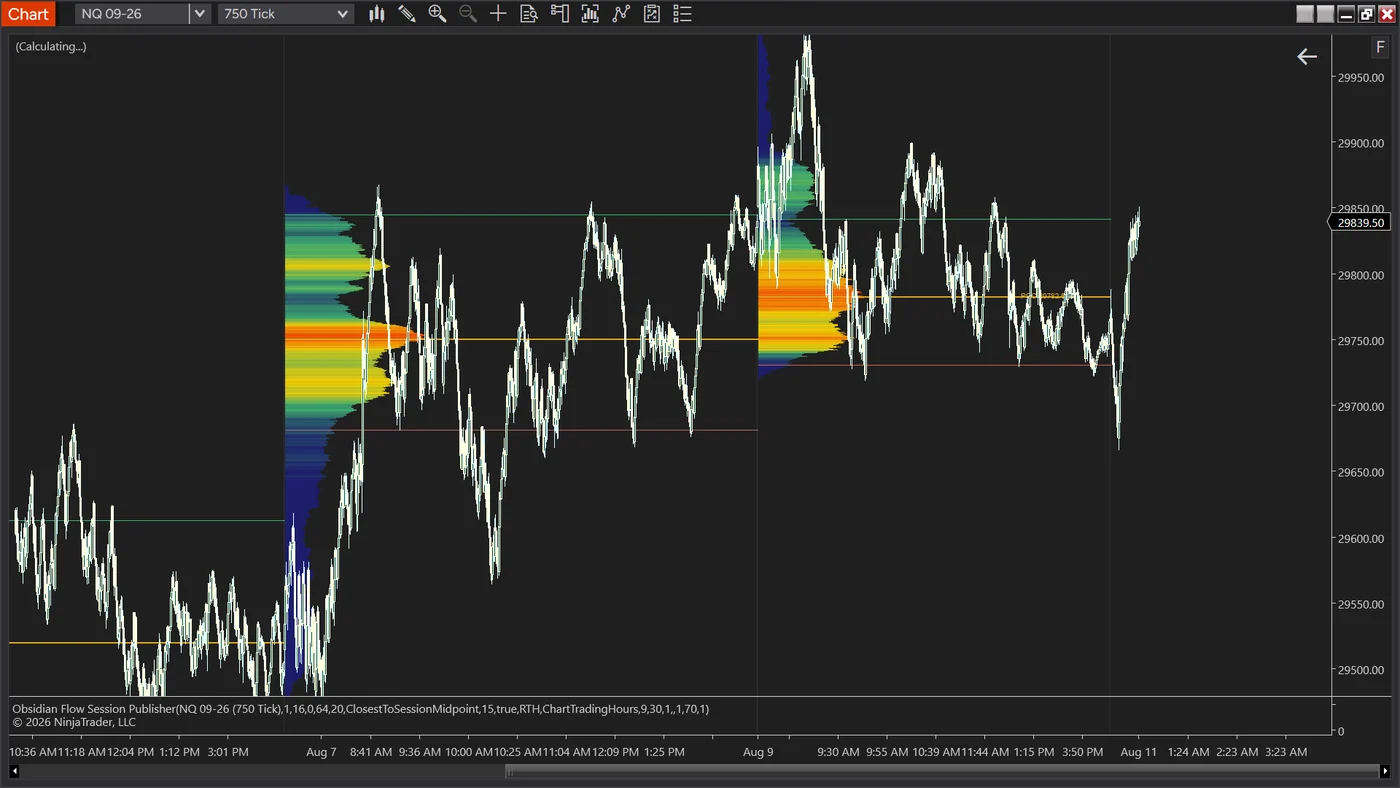
The same profile, closer inThe shape is the read. One broad shelf where the auction spent its time, thin tails where it did not. Price fell out of the shelf, came back to the point of control from underneath, ran along it, then went quickly through the thin volume below the value area low — the part of the range with nothing in it to slow price down.NQ 09-26 · 750 tick · heatmapThe same profile in heatmap mode, across two sessions. Red is where the auction spent its time — the point of control at 29750, drawn forward as the orange line. Price came back to that one line repeatedly over three days. The blue tails above and below are the thin volume, and the narrow profile on the right is the current session rebuilding from nothing.NQ 09-26 · two sessionsHistorical sessions left on, which is now the shipped default. Each day keeps its own profile and its own levels projected forward, so yesterday's point of control is still on the chart when price returns to it today — which, on the right-hand session here, is exactly what happened.
Included in Starter and above
Positioning
Where it fits.
The first thing a new customer puts on a chart, and the reference every other Obsidian Flow tool is read against.