<Obsidian Flow — Auction Theory

Auction Theory

Markets do not move because candles look bullish or bearish. They move because two-sided trade leaves balance, discovers a new area, and then either earns acceptance or gets rejected. This page shows the lens behind Obsidian Flow: structure first, participation second, execution last.

Price is not random. It is an auction looking for agreement.

Read the auction, not the noise.

Auction Market Theory is simple: when price spends time and volume in one place, that is balance. When price escapes that area, it is seeking a new area of agreement. The job is not to predict every candle. The job is to identify whether the market is accepting higher, rejecting lower, or trapping the side that arrived late.

Obsidian Flow is built around that exact idea. Your tools are not there to replace structure. They are there to show who is actually supporting the auction when price reaches a decision point.

Balance

Price rotates where both sides are willing to do business. Inside balance, aggression usually fades and chop increases.

Discovery

Once balance breaks, price travels to locate a new area of agreement. This is where initiative activity shows up.

Acceptance / Rejection

If the new area holds, the market is accepting. If price quickly gets denied and returns, the move was rejected.

Execution

The best entries come when structure and participation align at the same level, not when you chase in the middle.

01
Value

The market repeatedly trades where it considers price fair. That zone becomes the reference point for everything after it.

02
POC

The point of control is the price that did the most business. It often acts as a magnet, pivot, or line that must hold for continuation.

03
Failed Auction

When price tries to move away from value and cannot hold it, trapped traders fuel the move back through the range.

04
Initiative Activity

Real trend days are not random breakouts. They are auctions backed by committed participation that keeps defending the new area.

Case Study One

Reject lower. Accept higher. Defend the POC.

Two days of NQ, profiled together. The broad red band is where the auction actually spent its time, and the orange line drawn forward from it is the point of control. Price left that shelf, came back to the line, ran along it, and only trended once it lost it. The thin blue tails above and below are the prices the auction passed through without doing business — which is why price moves quickly through them and slowly through the shelf.
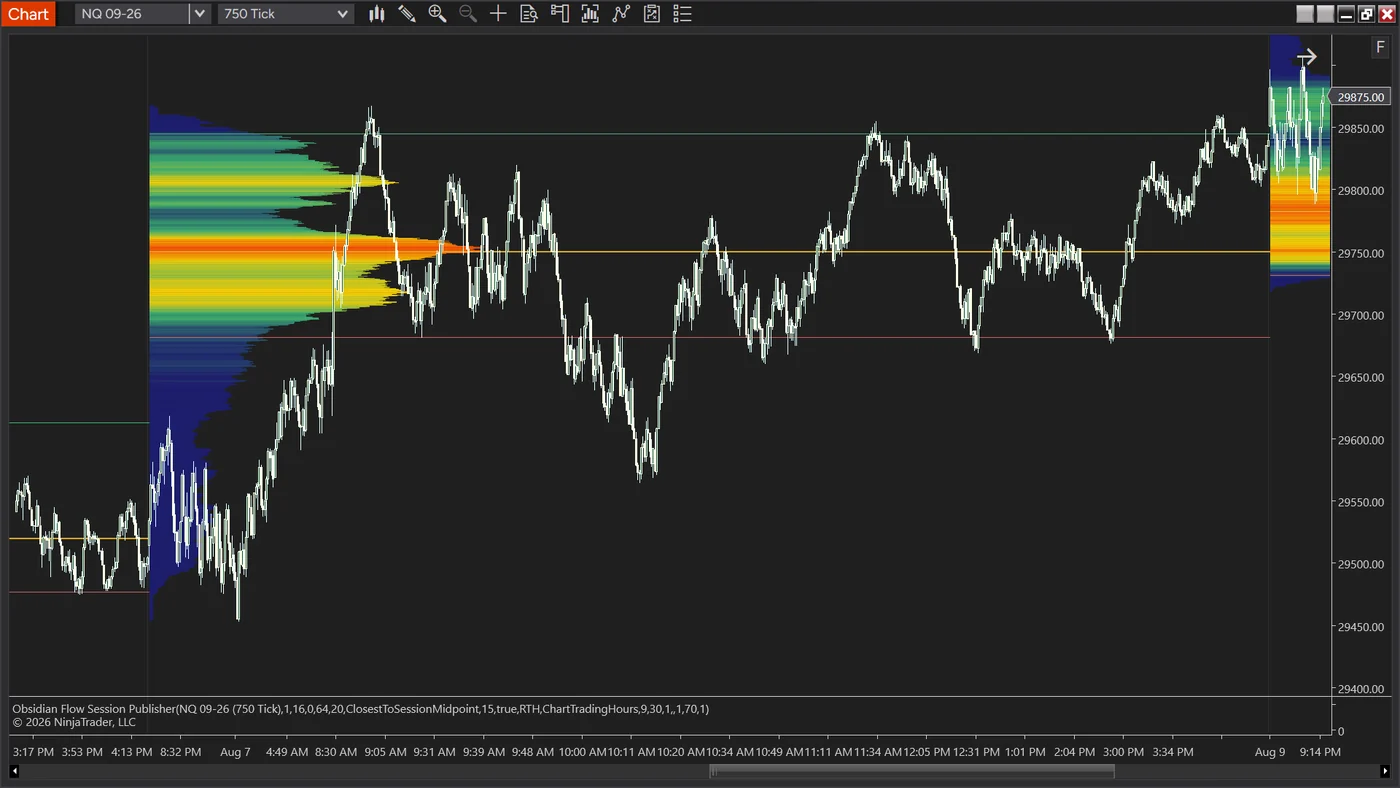
The shelf: Where the red is widest, the auction found two-sided business. Price is slow here because both sides keep agreeing.
The line: The point of control projected forward. It is not support — it is the price the auction rejected leaving.
The tails: Thin blue at the extremes. Nothing rested there, so nothing slows price down when it returns.
A two-day NQ volume profile in heatmap mode, running from deep blue at the extremes through green and yellow to a broad red band at 29750, with an orange point of control line extended right across the chart.

NQ 09-26 · 750 tick. The shape is the read: one broad shelf, thin tails, and a line the market kept returning to.

Case Study Two

When the auction is real, the defense survives the close.

The same instrument with each session keeping its own profile. Yesterday's point of control and value area are still drawn on the chart when today opens — and on the right-hand session, price returns to them and does business there again. That is what acceptance looks like as evidence rather than as a story: a level that mattered yesterday still organising trade today, across a close that should have reset everyone's attention.
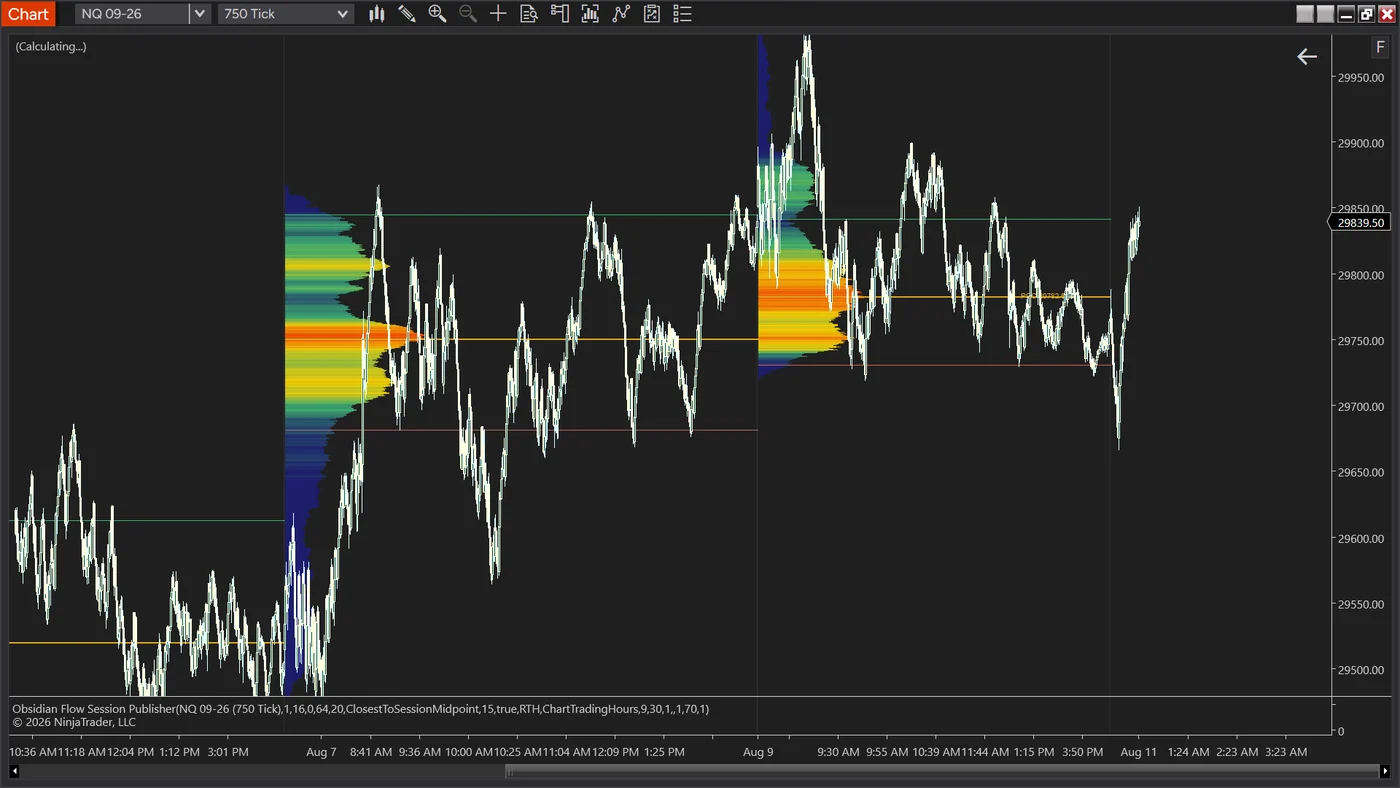
Levels survive the close: Each session's point of control and value area project forward into the next.
Acceptance, not memory: A level is only real if trade happens there again. This one gets tested and holds.
Two distributions: Where the second profile builds relative to the first is the whole question — higher, lower, or on top.
An NQ chart showing two separate session volume profiles side by side, each rendered as a heatmap with its own point of control, value area high and value area low projected forward across the following session.

NQ 09-26 · two sessions. Yesterday's value is still on the chart today, and price comes back to trade against it.

Your tools should confirm the auction, not distract from it.

Everything above is drawn from one number: how much traded at each price. That is what a profile is, and it is genuinely powerful — it tells you where the auction did business and where it refused to.

What it cannot tell you is who had to do it. Four thousand contracts at a price looks identical whether buyers lifted every offer to get them or sellers hit every bid. Same bar, same colour, opposite meaning. The profile is a record of the result; it holds no information about which side was forced.

That is a different measurement, and it needs the tape rather than the bars. True Aggression classifies every individual trade by which side crossed the spread to get filled, then builds the same three views you already think in from that one classification — a profile of initiative rather than volume, a rate of change so you can see when it accelerates, and a divergence when price and initiative stop agreeing. TA Zones then puts the level where initiative actually changed hands onto the price panel, so you are looking at a price rather than a histogram. The full reasoning behind this — the measurement gap, the five dimensions, the limitations and a validation program — is set out in the whitepaper.

The two answer different halves of the same question. The profile tells you which level matters. The aggression tools tell you whether the side defending it is committed or merely present — which is the difference between a level that holds and a level that looks like it should.

Bid / Ask Dominance

Shows when aggression is changing hands before the obvious candle expansion. It helps confirm whether the auction is being taken over or fading out.

True Aggression

Classifies every trade against the resting quote, so you can see which side is actually taking liquidity at a level rather than inferring it. That matters most when price is testing value, POC, or a defended edge.

Liquidity Behavior Engine

Makes order behavior visible where it matters most: at the level. When structure and liquidity behavior agree, execution becomes cleaner.

The market is always asking a question.
Who is willing to defend this price?

Auction Theory teaches you where to look. Obsidian Flow helps you see who is actually stepping in when the answer matters. That is how you stop guessing in the middle and start acting at the level.