01
Heatmap mode, so concentration reads as intensity rather than only as bar length.
Draw a profile across any range you like — a single leg, a two-week balance, the overnight, the move you are actually asking a question about. Same engine as the session profile, aimed wherever you point it.
An automatic session profile answers one question well: where did today trade. It cannot answer where the last three days of balance concentrated, or where the volume sat inside the leg that broke it, because those ranges do not start and end when the session does. This tool takes the same calculation and lets you put it anywhere — including across a range far longer than the chart's timeframe, which is how most people end up using it.
Heatmap mode, so concentration reads as intensity rather than only as bar length.
Grow left or right from either anchor, so profiles can sit clear of price.
High and low volume node highlighting with your own thresholds.
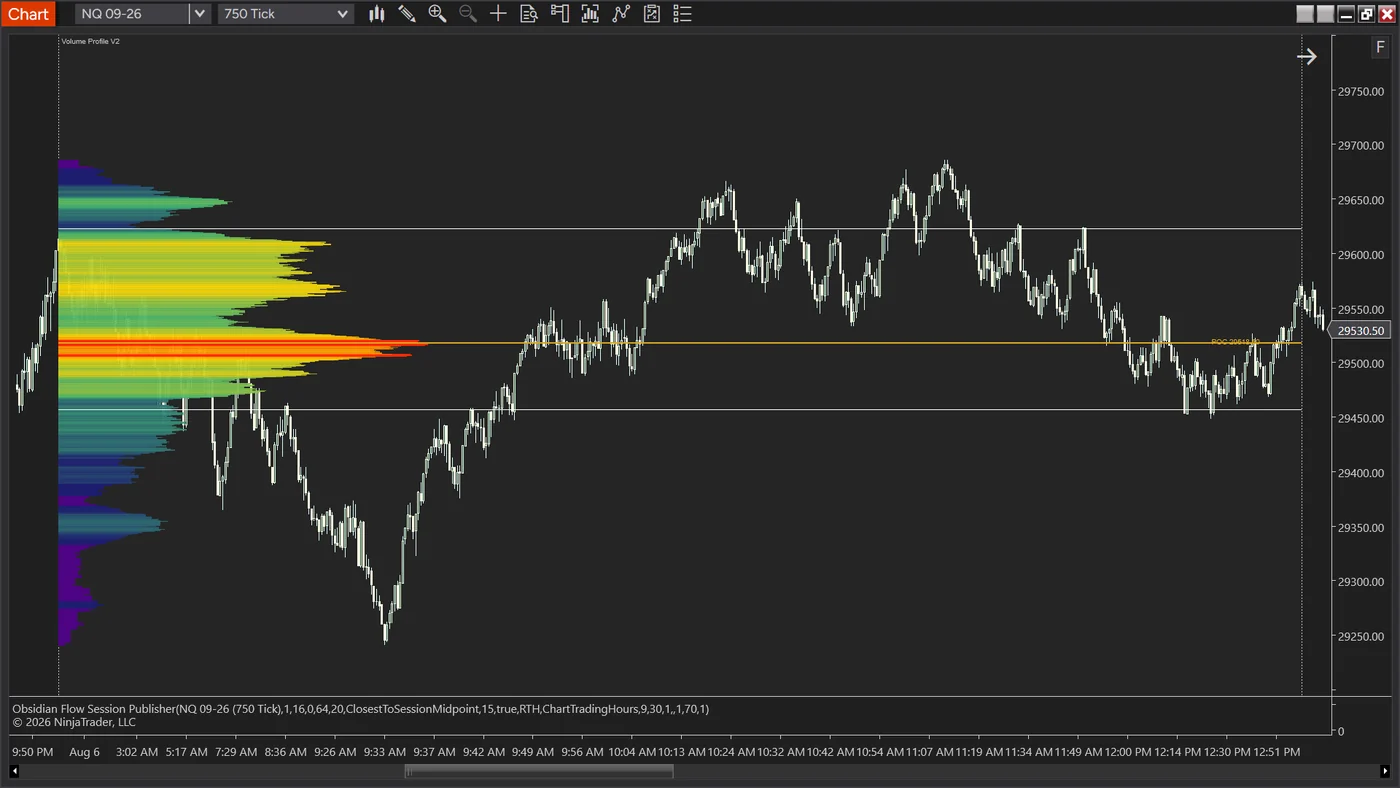
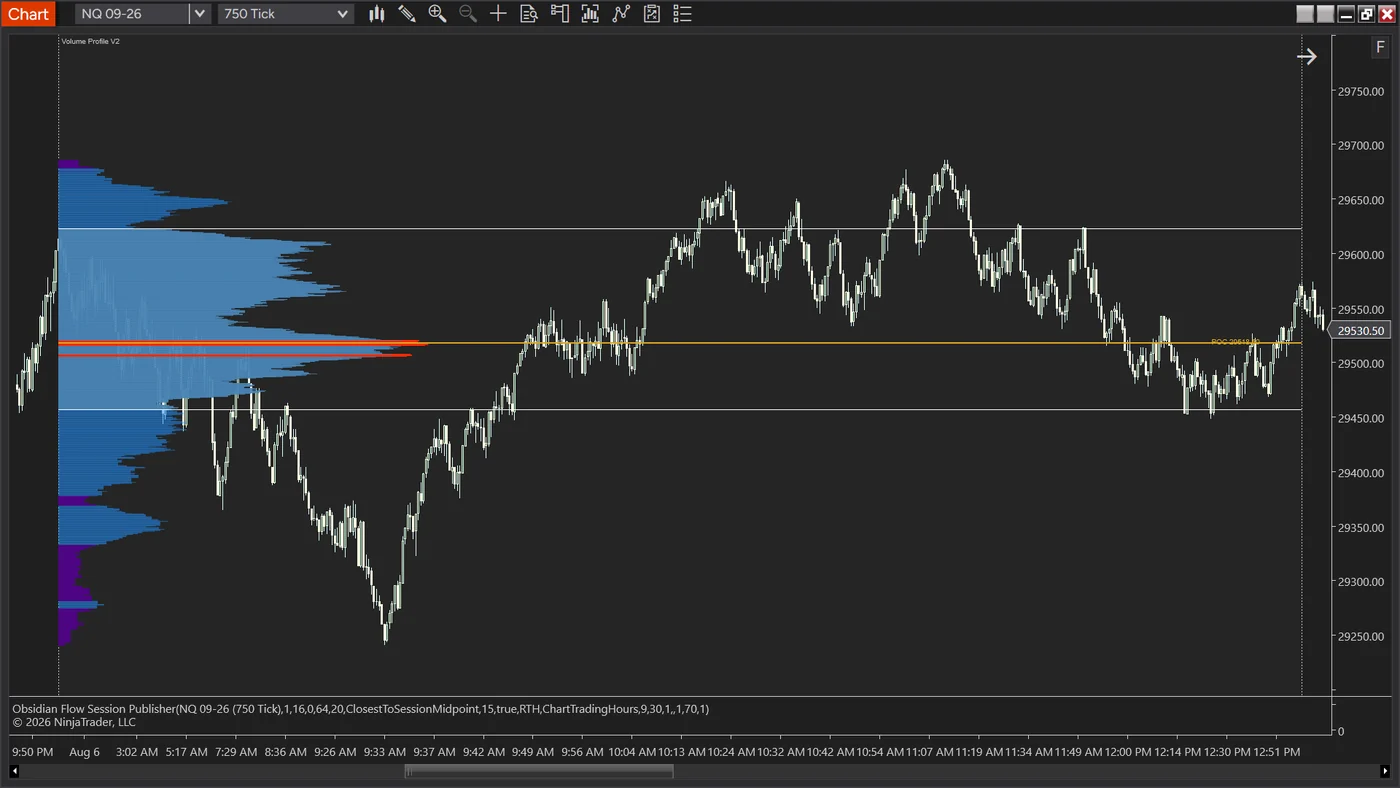
A profile drawn across two weeks of price is a large object, and like every NinjaTrader drawing object it stays selectable after you place it. Once it is where you want it, open its properties and set Locked to true. The tool then ignores the pointer entirely — clicks pass through to the chart underneath, and the profile cannot be nudged out of position by accident.
Three ways to get there: right-click the profile and choose Properties, or right-click the chart and use Drawing Objects to reach any object on it, or press Escape first if you are still in drawing mode. To move it again later, unlock it the same way.
Worth doing on any drawing object you have taken the time to position. It is the difference between a profile you placed once and a profile you keep re-placing.
The counterpart to the automatic session profile. One frames the day for you; this one frames whatever you are actually looking at.
Requires NinjaTrader 8. OF-VPT-001