INDICATOR
Most flips are noise. This one refuses to draw them.

TA Zones

The aggression tools tell you who was initiating. TA Zones takes the moment that reading actually changed hands and projects it forward as a zone on the price panel — so the level is on the chart before price returns to it, not explained afterwards.

Specification
Panel
Price panel overlay. Draws on any bar type.
Source
The same tick classification the True Aggression and Aggression ROC histograms use. Set the thresholds to match them and the three agree by construction.
Zone origin
Full bar, body, mid-half or a padded range — your choice.
Extension
Infinite, a fixed number of bars, until filled, or until the opposite side flips.
Calculation
On bar close, with a hidden 1-tick series added to the chart.
Built on refusal

Four conditions, and all four have to agree.

A zone appears only when the aggression threshold is crossed, the rate of change confirms the momentum behind it, price structurally reclaims or loses the level, and the bar closes on the right side of it. A flip that fails any one of those — absorption, a wick, a single aggressive print into a resting wall — creates nothing at all. The empty chart is the feature. Most zone indicators draw on every flip and leave you to filter them; this one does the filtering and draws far less.

01

Bullish and bearish zones with independent styling, opacity and extension.

02

Flip markers at the bar where initiative changed, separate from the zone itself.

03

Thresholds shared with the True Aggression and ROC histograms, so the three read as one system.
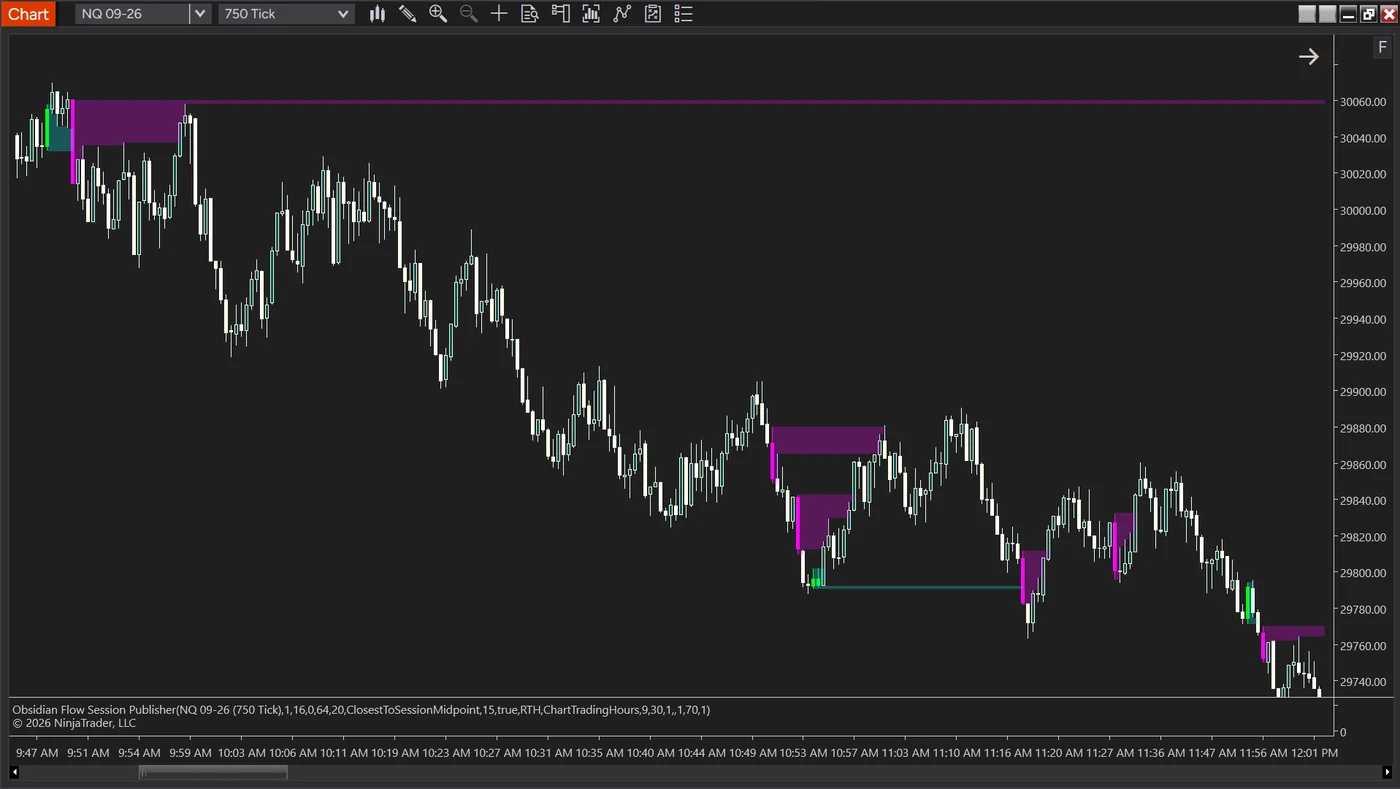
An NQ 750 tick chart from 9:47am to just after noon. Six shaded zones appear across the whole session: a large purple zone at the top around 30040-30060 with a magenta rail projected right from it, three more purple zones through the middle of the range near 29880 and 29830, one teal zone at 29790 with a teal rail projected right, and a final purple zone near 29765. The rest of the chart is plain candles.
NQ 09-26 · 750 tickAn NQ 750-tick chart with purple bearish zones and one teal bullish zone drawn across the morning. Bars fill the whole session; the tool drew six zones. Everything else that looked like a flip failed one of the four conditions and created nothing at all.
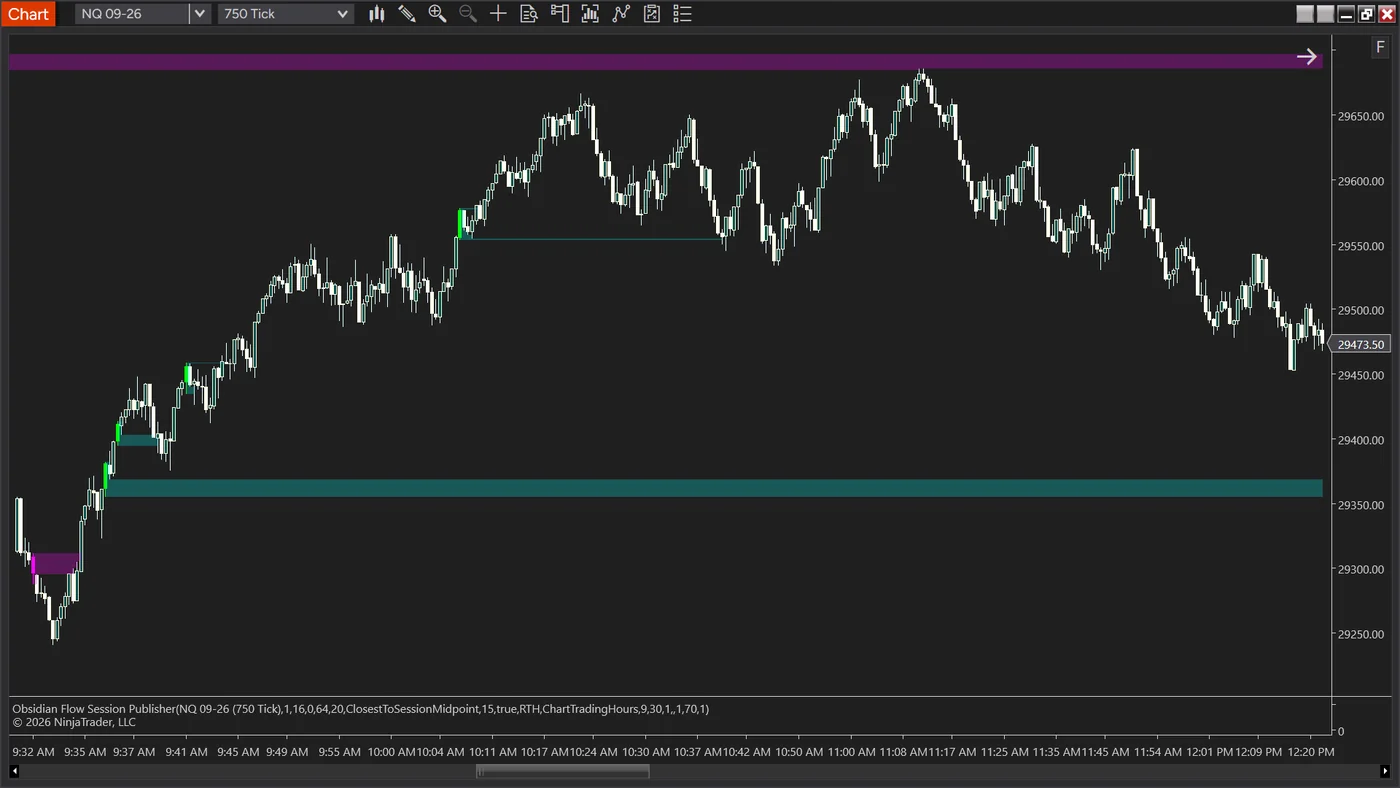
An NQ 750-tick chart with a purple zone extending across the top of the chart, a teal zone at 29365 extending right across the full width, and a shorter teal zone at 29555 that stops partway where price returned to it.
NQ 09-26 · 750 tick · extensionA different session, and the reason the extension setting matters. The teal zone at 29555 stops where price came back and took it; the one at 29365 is still open, projected right across the whole chart because nothing has returned to it yet. Zones end when the market ends them, not after a fixed number of bars.
Included in Professional and above
Positioning

Where it fits.

The visual end of the aggression pipeline. True Aggression tells you who is initiating, ROC tells you when that is accelerating, and Zones puts the level on the chart so you are looking at a price rather than a histogram.

Requires NinjaTrader 8. OF-TAZ-001